BC Agriculture Water Calculator
The Water Sustainability Act brought groundwater licencing into force on February 29th, 2016. To assist agricultural users in determining how much water to apply for the Province of BC approached the Partnership for Water Sustainability in BC to develop an on-line tool. This tool has now been developed and is on line at www.bcagriculturewatercalculator.ca.
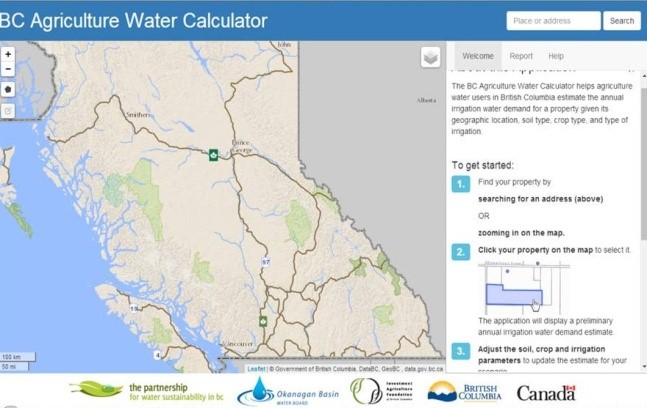
A user can use the tool search feature to locate their property or just continue to click on the map to zoom into their property. The image on the left shows the map of BC when a user first enters the tool. As a user clicks on the map and starts to zoom in, additional data layers are opened up as shown on the second image. Eventually the cadastre (property boundary) is shown. When clicking on a property, the property is highlighted and the information for the property is immediately shown on the right panel of the tool.
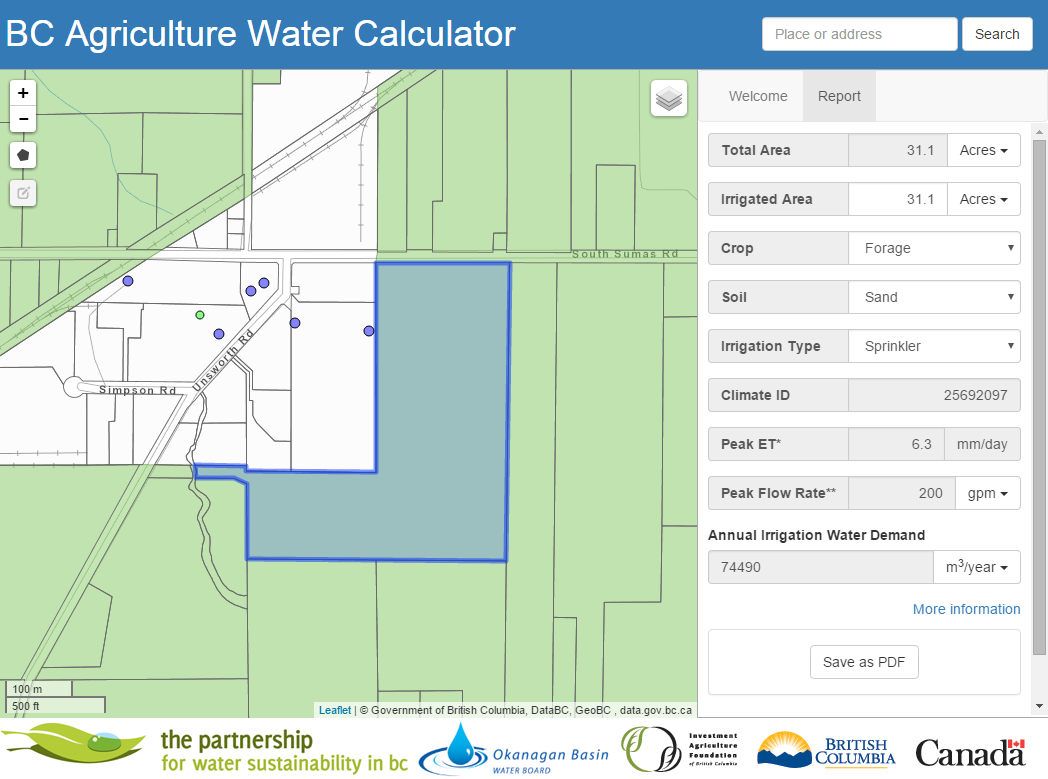
The calculator provides information on the property acreage and calculates a water demand for the entire acreage for a default forage crop, sandy loam soil and a sprinkler irrigation system. In this instance the property is 31.1 acres and will have an annual water demand of 74490 cubic meters. The peak flow rate would be 200 gpm. The user has the option of changing the crop, soil type and irrigation system type used by clicking on the arrow next to the box. The annual water demand value will change but the peak flow rate will remain the same. The annual water demand can also be presented in acre-feet which may be a more recognizable unit for users.
So how is the information determined? The province developed an Agriculture Water Demand Model which calculates water demand using downscaled climate data on a 500 m grid. The climate data uses information from nearby weather stations and also takes into account a number of parameters such as elevation, latitude and longitude, slope and other factors. Combined with irrigation efficiency and soil texture information a water demand can be calculated for each grid cell and is displayed in the calculator.
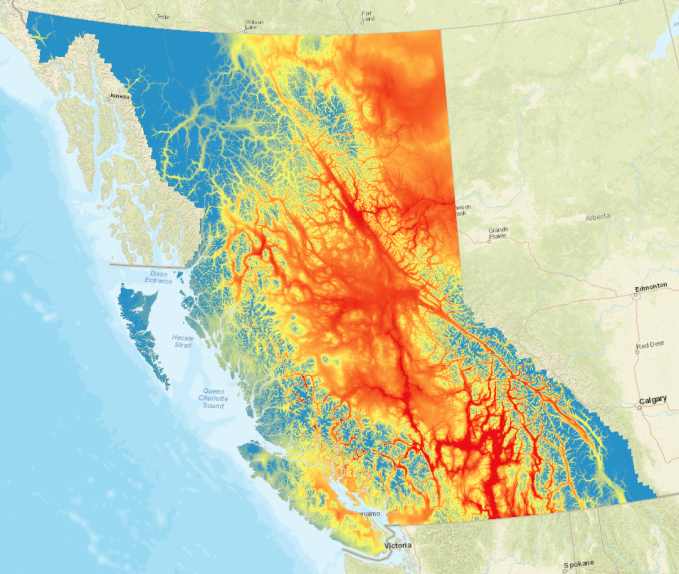
The application accesses the irrigation water demand (IWD) and Peak ET values at the 500 m x 500 m grid cell resolution of the climate datasets. Other data layers, both higher and lower resolution, are displayed for orientation, selection and area computation within the mapping framework, but the background data query operates at the climate cell level. The climate cells cover all of British Columbia (as shown on left) except for a very small portion in the extreme northwest tip of the province wedged in between the Yukon Territory and Alaska Panhandle.
The climate datasets are comprised of precipitation, minimum and maximum temperature surfaces with daily values for each of the 500m x 500m grid cells. For this project, ten years (2001 – 2010) from the historic climate observations dataset were modeled to produce annual irrigation water demands and 10-day peak evapotranspiration. The annual irrigation water demand values were averaged over the 10 year period for each climate cell to produce the calculator database value. For the peak ETs, the maximum 10-day value from the 10 year period was used.
Both the annual irrigation water demand and the peak ET value involve the reference evapotranspiration (ET0), calculated using FAO Penman Monteith equations. In their basic forms, the equations use varying minimum and maximum daily temperatures, elevation, latitude and binary settings for an interior or coastal location and a humid or arid overall climate. In these forms, the wind speed is fixed at 2 m per second and the dew point temperature is set at either 2 degrees Celsius for arid or semi-arid climates and 0 degrees for humid or sub-humid climates. The model was initially run with these basic settings and parameters to produce a reference ET0 value for each climate cell; different regionally-based settings were subsequently developed using modified settings for wind speeds and dew points.
There are a lot of computations that are summarized in a database used by the calculator to present the data provided in the tool. Recently livestock water use has also been added. Some upgrade features that are being worked on include allowing users to select water demand for a part season, and possibly allowing users to generate a map from the tool to be used in the water licence application.